Category Archives: Uncategorized

Measure (At Least) Twice

20180218_143538 - SmallBear with me here. I promise this is about software – but first I need to talk about building.

I have several uncles and uncles-in-law who are builders, and when I was younger I ended up helping out with minor jobs here and there. One of the most recurrent mantras was this one:

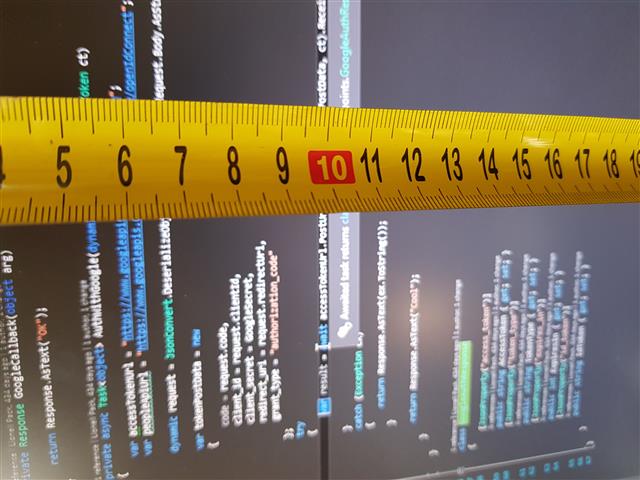
“Measure Twice, Cut Once.”

The idea, if it’s not immediately obvious, is that you double-check your measurements before committing to an action which is costly or hard to undo. Once you’ve cut that beam or board, you can’t un-cut it – the board will stay cut despite your best efforts to turn back time. If you cut it too small, you can no longer use it for what you planned to. If you cut it too big, you have to try again. Measuring is cheap – cutting is expensive. Measure twice, cut once.

I consistently see software engineers fail to even measure once.

I once reviewed a pull request from a developer who had decided to optimise part of our code base which performed intensive weather modelling. He had spent a week on it – and he had spent that time re-writing a large number of string plus operations to use StringBuilders. In some cases this can provide some performance benefit – but the re-written code was in the setup and teardown phases of the modelling. Setup and teardown took only seconds, while the modelling itself could take minutes or hours. Worse, this developer had introduced several bugs into previously-working code; but that would make this an anecdote for a blog post about the importance of testing and safe refactoring, and this is about measuring, so let’s focus on a different “worse”. Not only had he optimised the wrong part of the code base, but because he hadn’t measured performance, he couldn’t demonstrate that he’d actually made anything faster (aside from some vague assertions that StringBuilder is faster than string-plus, which isn’t always true).

I didn’t even need to measure to know that his change wasn’t going to make things significantly faster – the code wasn’t in a loop, and I knew that the overall modelling time was long. Shaving off microseconds at a time in a scenario like that is a losing game. The other reason I knew for certain that his change wasn’t going to pay dividends was that I had already spent quite some time improving the efficiency of that setup process. We had benchmark tests around parts of that code, and we had made significant wins. Most of them were had by fixing the .GetHashCode and .Equals methods of a custom coordinate class we were using. We were wrangling a fairly large amount of data into data structures needed by the modelling code, and set operations like .Contains were taking far too long. It turns out both .GetHashCode and .Equals were creating additional instances of the class to perform certain comparisons, and so we were churning the garbage collector as well as performing far too many operations. Some careful tweaks to those methods – operations performed many times within nested loops – took our setup time down from minutes to seconds. We knew that we’d made things better because we were measuring – but the benefits of measurement go much deeper than just knowing how you did.

All developers fall somewhere on the spectrum between, roughly, terrible and genius. I’m not sure where on that spectrum I fall (I suspect it varies depending on what sort of programming I’m doing), but I am pretty sure that I wasn’t good enough to read through thousands of lines of C# across many different files and realise, through pure mental analysis, that we had a performance problem in our coordinate comparison code. Even if I had noticed that it wasn’t efficient, I wouldn’t have been sure how much the problem was contributing to our run time (as compared to, say, our inefficient string concatenation). Instead, I found out by measuring.

In this case, I used one of the simplest of all code profiling techniques: the pause button in my debugger. Simply run your code, and sometime during the long-running process, hit pause. The line you’ve broken on is extremely likely to be part of the problem. Typically, it will fall into one of two categories:
1. A line which is executing many times. In this situation, something further up the stack trace is calling the code you’re looking at inside a large (or nested) loop.
2. A line which is taking a long time to execute. Perhaps it’s hitting disk or network and waiting a long time before continuing.
There is a third (statisically less-likely) option: you’ve just happened to break execution somewhere that isn’t part of the performance problem. That’s why you measure (at least) twice. Break your long-running operation a few times, and compare the stack traces. If your stack dump consistently looks the same, you’ve found your performance hot-spot.

That’s one of the simplest ways of measuring your code, and it may suffice for tracking down hot-spots, but there is a lot more to measurement than just hitting pause in your debugger. Do you suspect you have a database problem? Don’t go hunting through code looking for your favourite anti-patterns. Instead, measure the number of database round-trips your operation makes. Use your database tools to identify expensive queries – and even once you’ve found them, don’t necessarily just start staring at code. Are you missing an index? There are tools which can tell you. Even if the query is bad, looking at the query plan will tell you exactly which parts of the query are causing the problem, so you don’t need to guess.

Maybe you are hitting multiple services and combining the results? If you’ve just learned about the async keyword, you might be tempted to dive in and start making everything async – but if almost all of the delay is coming from a single call, it might not help much (you’d be better trying to find out why that service is so slow). If you really are dealing with multiple similar-cost calls which you combine after they’re all complete, async may be a good investment of your time – but you won’t know until you’ve measured.

For one weather-forecasting algorithm I measured, I didn’t turn up anything obvious. I measured and measured some more, and eventually I discovered we were utilising the CPU cache poorly – the bulk of our algorithm time was spent fetching data from main memory after cache misses. Updating the algorithm was a very costly measure, but investing in hardware with better memory bandwidth gave us some short-term wins. There are very few developers who can look at an algorithm and spot a cache utilisation problem, but measurement can find it for you.

I think I understand why some developers prefer to dive right into code, instead of measuring the problem. We like to think we’re smart. We know stuff about coding, and we’re good at it, and so we can jump in and spot what the original developer didn’t. We can use the sheer power of our minds to solve the problem. It’s a little like the builder who drives in nails with his forehead. It might be impressive, but it’s not very effective, and you’ll end up with a headache.

The opposite problem happens too: we make the mistake of not valuing our time. “What can it hurt to spend a week re-writing those string-plus operations as StringBuilder operations,” we ask ourselves. It makes our code better (by one measure, I suppose), and it won’t hurt performance. But if we spend a week of our time, was it really worth the investment? Measure up front, so you can make that decision based on facts instead of guesses.

Perhaps some developers just feel like they have great intuition. One of my uncles was actually pretty good at estimation: he’d cut timber a shade too big, and trim it down as he was placing it. He only did that occasionally, though. A lifetime of building told him when it made sense to trust his estimation skills, and when to measure twice, cut once.

So we’re back to builders, and here’s the deep lesson. If a builder will measure twice to avoid wasting a bit of cheap wood, how much more should we measure to avoid wasting precious time? I’ve seen weeks wasted on the wrong problem, simply because someone didn’t bother to measure.

Please, my fellow developers: measure (at least) twice.

Helping Your Best Developers Leave

It’s my job to help my team members find better jobs. I know that sounds a little counter-intuitive, but stick with me for this one – I hope I can convince you.

There are two types of software developers: wanderers and lifers. Wanderers drift from job to job. They may stick around at a job for a year, or five, or even ten, but the one constant throughout their career is that they don’t intend to stay in their current job forever. The reasons change from person to person, and from job to job: sometimes they just hate their job; sometimes they’re in over their head; some people just love variety. Whatever the reason, they know that their next job won’t be the one they stay in any more than the last one was.

Then, there are the lifers. They may not stay in any one job for good either – people get made redundant, companies go broke, and changing circumstances force lifers to change jobs, but their goal is to find a team they like (or can tolerate) and stay in it as long as they can. The motivations for lifers vary, too, and it’s not just being scared of change: they may enjoy developing a deep knowledge of the business domain, the company culture, or the niche industry they’re in, and prefer leveraging that knowledge to starting fresh somewhere new.

Lifers can become a problem, though: if you’re a good environment for lifers, you will tend to collect them. Even if you’re a bad environment for lifers, you will tend to collect them. Every time you replace someone, they probably left because they were a wanderer – and some of the time, you’ll end up replacing them with a lifer. The reverse almost never happens: your lifers aren’t leaving (if they are, you might have bigger problems), so you can’t replace them with wanderers.

Before we get too far into this, I want to clarify something: I don’t buy into the stereotype that lifers are bad developers, and wanderers are good ones. There’s a bit of an attitude that anyone who stays in one place for too long “got stuck there”, while people who move from job to job are “in demand”. I’ve had plenty of recruiters talk to me in these terms. Too-frequent job hopping is bad (“they can’t hold down a job”), but staying in one place for too long is considered bad too. To speak frankly: this stereotype is rubbish. There are plenty of smart, productive developers who find themselves great jobs – which let them do interesting, intellectually-challenging computer science or engineering – and stay in them. Conversely, there are plenty of developers who drift from job to job, never really contributing much, but neither being quite bad enough to be worth firing.

But that’s an aside: I’m not writing this to tell you how to hire and retain good developers (I’ve written plenty of other articles about that). This time, I’m telling you how to get rid of your good developers! But first, more about why.

Remember how I told you that teams naturally accumulate lifers? Well, if you’re too complacent, you’ll also accumulate bad developers who have discovered your team is a safe place to hide. Wanderers who are just not much good (and don’t want to improve) will latch onto a team which tolerates them, and will milk it for all it’s worth.

There’s another big problem: market rates for developers have consistently risen faster than inflation, while salary increases almost never keep up. That means that the intermediate developer you hire today is probably getting paid more than the junior you hired five years ago – even though the ex-junior may well be worth more by now. Worse: if the junior hangs around to become a senior, they may well be one of your most valuable team members – and one of your lowest-paid ones. Why is this a problem? Well, aside from it being really unfair, it also sets them up to be poached. Even the staunchest lifer will eventually be tempted away by market rates, and if they’re even a little good at math, when they do the calculus, they’ll resent you for all the missed income over the years.

It gets worse: the longer they hang around before being poached, the more reliant on them you become. You may well be incurring some really significant business risks by hanging onto your developers for too long.

You could solve all of these problems by aggressively monitoring productivity and performance, firing the under-performers, and rewarding the achievers – and if you try this approach, you won’t be alone: software giants (and many other major employers) have dubbed this the “up or out” system (it was originally termed the “Cravath System”), and it kind of works OK – for them. Unless you’re Cisco or Google, I bet you can’t make it work at all: measuring developer effectiveness is famously difficult and error-prone. You might just find you end up promoting the networkers, self-promoters, and empire-builders, and firing your good engineers. In fact, even the software giants probably do this more than they’d like to admit.

What is a CTO, team lead, or development manager to do? Easy. Help prepare your developers to get better jobs elsewhere. One of my favourite software quotes came in response to a question about funding developer training: “What if we pay for all this training, and they leave?” The response: “What if we don’t, and they stay?” (I’m not certain of the origin of the quote, but Martin Risgaard tweeted something similar back in 2012). I think every good software team needs to double down on this idea. Don’t just pay for PluralSight accounts. Don’t just send your developers to a token conference every year. Really invest in turning your team members into people who are just too good to stay. If someone hangs around for six or eight years, you’re failing – or perhaps they will just never become the sort of developer teams want to hire. Perhaps you will eventually need to force them out – but now you will know it’s not just because of some silly “up-or-out” rule, but because you’ve done everything you can to help them thrive, and it hasn’t worked. This is good for you, and it’s good for them: you’re not dooming them to a career as one of the “got stuck there” brigade, and you’re also not letting them hang around in a job which just isn’t succeeding at building their career. Let’s face it: it’s entirely possible that their lack of success is as much your fault as it is theirs.

So, is there room in this philosophy for the genuine, high-achieving lifer? That rare individual who develops a deep understanding of your industry, continually improves themselves, boosts their team performance, and has a track record of innovation, year in and year out, for five, ten, or more years? Yes, absolutely. The best-laid plans rarely survive first contact, and you will absolutely run into people throughout your career who buck this trend, and should definitely be allowed to hang around for decades.

If this sounds like I’m back-tracking on everything I’ve said, you’re right – sometimes, there’s just no alternative but to have experienced and knowledgeable team leads, managers, and company officers who know when to exercise discretion and ignore all the rules. My central message here is not that you should fire anyone who makes it to their 10-year anniversary: rather, you should focus on doing your very best to turn your developers into the sorts of professionals who are in-demand and will definitely be hired away. On the way through, you’ll build a more effective team. You’ll create an environment which will encourage past employees to return – and they’ll be developers you’ll want back. Your team reputation will spread, as past employees go out into the general software industry and talk about everything they learned, and everything they accomplished. It will cost you more per developer, but you will reap the rewards many times over – and please, never underestimate the enormous benefit of having a team which can easily attract high-quality developers when you need them.

Most software teams have a long way to go – so you need some first steps. Here they are:
1. Invest in your employees. Don’t just allocate budget to buy them a hotel and a conference ticket every year – find real ways to help them learn and grow.
2. Support your employees in finding the next step in their career once you’ve finished learning from each other.
3. Expect great things of genuinely outstanding long-term employees – and find ways to reward them commensurately.

Above all, don’t make the mistake so many employers do – the mistake of encouraging employees to stay too long.

One final note: if you haven’t been embracing these ideas, don’t try to implement things too quickly. If you’ve spent the past ten years not investing in your employees, trying to move senior talent out could well be disastrous: it takes time to build the right sort of turnover, and to decide to hang onto the rare lifer who you really want to keep around. If you’re not sure, it’s safer to err on the side of spending more time investing in your existing employees, and giving them more time to find their next career move (or proving that they’re genuinely worth keeping around, at above-market rates).

On FizzBuzz and interviewing developers

Lots of people have heard of the FizzBuzz interview test (if you haven’t, Google it!), and Jeff Atwood once famously asked: “Why can’t programmers.. program?” But is it a useful test?

I’ve interviewed lots of developers, and hired quite a few of them. I’ve only regretted a handful of hires, and I’ve spent a lot of time trying to work out how to improve. I’ve made a career out of building teams, and hiring good people is a key part of that. Posing a simple programming challenge – often referred to as a FizzBuzz problem – is a common strategy, and it’s one that interviewers and job-seekers should both understand.

FizzBuzz is Pass/Fail.

One of the mistakes I think people make is in judging the code people write. I always put candidates through a FizzBuzz-type test, but I don’t really care about how good their implementation is. I have one very specific thing I want to know: can they write code, or can they not?

The pass/fail nature of FizzBuzz isn’t the sort of pass/fail you write a unit test for. I have no interest in whether the string they output has correct spacing, or whether they even get the calculation correct. I want an answer to this question:

Has this candidate spent even a little bit of their recent career writing code?

If I’m asking someone to solve FizzBuzz, I’m not hiring a program manager, a technical writer, or a business analyst. I’m hiring someone to write code. I’m hoping to hire someone who can write good code, which solves the correct problem, and produces a good user experience, and doesn’t introduce performance problems, but the core skill I’m looking for is the ability to write code. If they can’t write code at all, the quality or correctness of the code they write isn’t a concern.

FizzBuzz is trivial.

I’ve heard people lump FizzBuzz in with algorithmic problems, like asking a candidate to solve the traveling salesman problem. I’ll admit: if I was asking someone to solve FizzBuzz and send me their answer, it’s an algorithm problem. A very simple one, which I’d expect a high-school student doing a programming course to cope with, but an algorithm problem nonetheless. I don’t ask people to submit a solution, though: I ask them to do it in front of me, and what I’m really interested in is the first step.

Loops are one of the simplest programming concepts.

Fundamentally, programming is about loops and conditions. There are higher-level concepts that are really important, but you really don’t get any simpler than loops and conditions. FizzBuzz has a really simple beginning: “go through the numbers between one and twenty, and …”

The rest doesn’t really matter. I’ll pass someone who isn’t sure about how to work out if a number is a multiple of 3, or 4, or both. I want to know if the candidate can take a really simple problem statement, with an extremely obvious first step, and make a start writing a really simple solution.

People Fail FizzBuzz.

Do 199 candidates out of 200 fail FizzBuzz? No way. If that many fail, you are interviewing people you shouldn’t. Most people I interview have no trouble at all passing FizzBuzz, because I don’t interview people unless I think I might want to hire them. I simply don’t have the time to interview 200 people to find one who can pass FizzBuzz. Nobody has that kind of time to waste.

FizzBuzz is pass/pass.

You shouldn’t be interviewing people who can’t pass FizzBuzz. FizzBuzz is trivial. It’s the sort of simple problem that professional developers can’t have trouble with. Asking a professional developer to write a solution to FizzBuzz is like asking a professional mathematician to solve 5+4.

If FizzBuzz is so simple, why even ask it?

I get candidates to solve FizzBuzz because I’m going to actually test their technical skills later in the interview, and I want them to be comfortable. Interviews are stressful, and the best way to take someone from stressed to comfortable is to let them succeed – and not just succeed, but easily succeed. FizzBuzz lets someone with even the most basic programming ability succeed, and that lets them relax – and that makes it easier for them to show me why they’re worth hiring.

“Interviews are stressful” is no excuse.

I’ve seen plenty of people complain that asking developers to write code during an interview is unfair, because interviews are stressful, and that makes it hard for candidates to perform.

Yes. That’s the point. Let me tell you a story.

My team was releasing a new feature to a business-critical site. I do similar things all the time – that’s my job – but this time, something went wrong. The moment someone hit the site, the server went to 100% processor utilization and stopped responding. Ten minutes later, we managed to kill the process and roll the update back. We postponed the update until tomorrow, and started trying to diagnose the problem.

We couldn’t.

Several person-days worth of testing and analysis later, we hadn’t been able to replicate the problem in any of our test environments, so we decided to deploy the new version again (with a few minor tweaks). Once again, the server went to 100% CPU usage, and after about 10 minutes we were able to roll back the update. We were behind schedule, and senior management started to get involved.

Evenings and weekends were cancelled, experts were consulted, and we put a number of measures in place to ensure the new features went out successfully. We rolled back a number of non-critical changes. We put additional testing in place. We put some data collection in place to collect memory dumps, and we deployed – and our production system came to a screaming halt. Everything froze, and we rolled back. Senior management were upset, and my team’s credibility was at stake. Consultants were being brought in. We collected dump files, fired up debuggers – and diagnosed a faulty third-party library which was misbehaving on some edge-case which only happened in production.

Excising the third-party library and getting a working version tested and released wasn’t an easy task, but it had to happen fast. With the problem identified, we wrote a pile of code at very short notice, got it tested, and pushed it into production – and everything worked. The whole situation lasted only a few days, but the pressure to identify and fix the problem was tremendous, and my team was suddenly under a spotlight.

I need to hire people who can write code under stress.

As a team lead, it’s my job to make sure our team doesn’t end up in high-stress, tight-deadline situations. As a manager, it’s my boss’s job to ensure that stress doesn’t get passed on to my team. But sometimes it goes that way, and when it comes right down to it, I want a team filled with people who can write good code in stressful situations.

Professional developers write code.

When you get right down to it, the job of a developer is to write working code. However you boil it down, someone with any kind of experience – even experience as a student – should have spent plenty of time writing software. Trivial problems should be trivial, even under stress (the kind of stress that happens in real life, whether it’s in exams, during assignment periods, or at work) – and in fact, even moderate or difficult problems should be manageable under stress.

Someone who can’t solve FizzBuzz under stress isn’t someone I want on my team.

This is what it gets down to. FizzBuzz is trivial. It’s not the problem: as I discussed earlier, FizzBuzz is the simple introduction, designed to help people relax. I’ve seen it work, over and over: stressed people, nervous in a job-interview situation, are distracted by their interest in writing code. Someone who came in to an interview nervous has an easy win, and goes on to tackle some of the harder technical problems I have for them with confidence.

At the end of it all, if you can’t solve FizzBuzz under interview-stress conditions, I can’t trust you to be on my team.

I’ve probably turned down one or two developers I shouldn’t have, over the years, because they froze and couldn’t solve FizzBuzz in the moment. I have successfully built teams full of successful people, though. It hasn’t been by making people solve a FizzBuzz-like problem before hiring them – but watching candidates try to solve such simple problems has been a key part of deciding whether to hire them or not.

In Summary…

FizzBuzz, on its own, is a terrible way to judge whether to hire someone or not – but it is a tremendously useful tool for a team lead who is trying to decide whether someone will be a great team member or not.

Serverless Deployment with Azure and Octopus

Azure’s Platform-as-a-Service offering provides the promise of deploying applications, databases, file shares, buses, caches, and other infrastructure without ever needing to spin up a server. That means no operating system to manage, no IP addresses, no need to configure IIS or SQL Server or any of those other platforms. This hopefully lets us spend less time yak-shaving; but most of us are used to deploying things to servers, and so we’ll need to integrate this new serverless mindset with our existing deployment tool chain.

I dove into this proof-of-concept expecting to write piles of PowerShell, but it turns out the teams at Microsoft and Octopus Deploy have already done most of the heavy lifting – as you’ll see.

My goal is to be able to build entirely new test environments from scratch in as few steps as possible. It turns out, with the right planning, fully-automated deployments of both application and infrastructure are possible.

The Azure Story

First of all, you’ll want a fully-updated Visual Studio installation with the Azure SDK enabled. We like to keep everything necessary to run an application or service together in one repository: code, schema, and now – infrastructure! The Azure Resource Manager (ARM) lets us define infrastructure using JSON files called templates, and Octopus lets us deploy them just as easily as we deploy applications.

I’m going to show a fairly limited example here – just a Nancy service and a database – but ARM templates are very powerful: you can build just about anything Azure provides with them, and Visual Studio has a number of templates to get you started. To start out, create a new Azure Resource Group project alongside your existing application projects.

You’ll have the opportunity straight away to select a template: all I need is a SQL database and a web application, so I’m choosing the “Web app + SQL” template. You’ll be able to add more resources later, so just pick whichever template gives you the best start towards what you need.

The first thing you’ll notice is that you have a .json file, a .parameters.json file, and a deployment script. We’re going to use Octopus to handle the deployment and variable replacement, so we’re mainly interested in the .json file.

Open up the JSON Outline window in Visual Studio. It will give you a great overview of the template you’re working on:

This template is ready to deploy to Azure now, but it needs a few changes to work nicely with Octopus. Octopus ties in really nicely with the parameters in the ARM template, but it doesn’t work so well with the variables you can see in the JSON outline – they tie back to the .template.json file, and we don’t want that.

It’s quite straight-forward to change those variables into parameters, and then you have something ready to start putting into Octopus.

There’s a lot more to getting your ARM template just right, and I highly recommend you spend some time taking a deep-dive into ARM and all the features it gives you. Get something running, and start trying things.

The Octopus Story

We have an existing on-premise Octopus server which is deploying well over a dozen different applications, and we want to keep that as a core part of our tool-chain. If you don’t have an existing Octopus server, it’s very easy to install an on-premise trial server, or if you’re going 100% Azure there’s an Octopus server template ready to spin up. If you don’t fit within the free tier, give it a shot using the trial license: you’ll love it.

Start with a Project

If you’ve never used Octopus before, there’s a lot to learn, but there’s one easy place to start: create a project. Projects are things you want to deploy: they can be small services, or they can be entire application environments with many steps. It turns out they don’t just deploy software; they also deploy infrastructure.

Azure templates are all about resource groups. A resource group is exactly what the name says: a grouping of resources which you can treat as a single unit. Unfortunately, Octopus doesn’t create our resource group for us. Fortunately, it’s very easy to create one using PowerShell. This is easier than it sounds: in your new project, click the “Add step” button, and select “Run an Azure PowerShell Script”.

I called my step “Create Resource Group”. This ends up being a single line:

New-AzureRmResourceGroup -Name Application-#{Octopus.Environment.Name} -Location australiaeast -Force

Notice that I’m using {Octopus.Environment.Name} here: you’re going to see that a lot. I don’t want to waste time setting up variables for things like database connection strings for each environment, so I’m going to use the environment name as much as possible.

The next step you need to create will deploy your ARM template: again, Octopus is ready with a pre-made step to do exactly that.

I named this step “Provision Environment” – it’s going to pass your ARM template to Azure, and ask it to create all the infrastructure you need to deploy your environment.

It might look like you need to select a fixed resource group for this step, but if you choose the “Use a custom expression” option from the drop-down to the right of the Resource Group box, you can write an expression.

Make it match the resource group we created in the previous step:

Application-#{Octopus.Environment.Name}

You’ll need to understand the difference between Complete and Incremental modes: Complete essentially means that any deployment to the template will delete any resources which aren’t in the deployment. Incremental means it will only update existing resources and create new ones. There are arguments both ways, and I won’t go into that in this post.

The really important thing is the Template. For now, it’s easiest to paste your template from Visual Studio straight into Octopus:

Eventually, you’re going to want your build environment to publish your template project as a package, so Octopus will stay up-to-date with any template changes automatically.

Octopus auto-magically exposes all the parameters from your ARM template, and you can use all the usual Octopus variables to complete these. Once again, I highly recommend driving everything off the environment name: you don’t want lots of variables to configure every time you create a new environment.

Remember, the goal we’re working towards is being able to create a fresh environment and deploy straight to it with no additional steps.

Now that your infrastructure step is complete, you need to deploy your actual application. I’m going to skip all the detail of publishing nuget packages to the Octopus feed: if you don’t have an existing CI/CD pipeline, you can upload nuget packages containing your application straight into the Octopus UI.

Once Octopus knows about your nuget package, you can create a “Deploy an Azure Web App” step to publish your application to the endpoint you created in step two.

You’ll need to build the web app name using the same expression you used to create it in step two:

Our project is a NancyFx project rather than Mvc or WebApi, but it all just worked. Our database schema is deployed using a Deploy.ps1 script (use a schema management system like NSchemer or DbUp to deploy and update your database schema), and that just works too.

You’ll need to setup up any connection strings and other environmental variables your application needs: again, focus on building these using #{Octopus.Environment.Name} so there’s no need to set up per-environment values.

Create an environment, hit deploy, and you should find your application is up and running – and any changes you make in your project, to either environment, schema, or application, get deployed to your new environment.

If you want to stop paying for all this infrastructure, just sign in to the Azure portal and delete the entire matching resource group. Boom! Everything is gone. (Don’t do this to production!)

Where Next?

This is really just a proof of concept. There’s no reason this couldn’t be extended to include VMs running services, if you really need that. You can add other resources to the base template you added.

We have a number of applications with a microservices backend. I want to be able to deploy feature branches across services: an environment containing all of the feature branches for a particular ticket or story, along with the master branch for any other dependencies. This feature-branch-environment will become a target for automated integration tests, as well as end-user feedback.

I haven’t planned out the whole system yet, but the integration between Octopus and Azure has been so seamless that I expect to be able to build exactly the CI/CD pipeline I want.

Why We Dispose Things

Pop quiz: Why do we use IDisposable?

If you said something like “To allow us to clean up unmanaged resources”, I have good news: most other people make the same mistake.

The correct answer is “To make our code faster and more predictable.”

Don’t believe me? Let me try to convince you.

Consider the following:

void Main()
{
     var thing = new Thing();
     GC.Collect();                  // It doesn't matter what you do
     GC.WaitForFullGCComplete();    // Or how long you wait
     GC.WaitForPendingFinalizers(); // Thing will never release its resource
}

public class Thing : IDisposable {
      public object FakeResource = new object();
      public void Dispose() {
            // Do not implement the Disposable pattern this way!
           FakeResource = null;
           "Resource released!".Dump();     // This never happens
     }
}

It doesn’t matter how thoroughly you implement IDisposable. If somebody using your code fails to call the Dispose() method (or wrap your object in a using block), your resources will never be released. If you’re looking to ensure your resources are released, you should implement a finalizer:

void Main()
{
     var thing = new Thing();
}

public class Thing {
     public object FakeResource = new object();
     ~Thing() {
           FakeResource = null;
           "Resource released!".Dump();
     }
}

This guarantees that our resource will be released – however, it doesn’t guarantee when it will be released. In fact, when I ran that code, the first two runs didn’t print anything, and the third run printed the message twice. The fourth run printed the message twice again (LINQPad doesn’t unload the app domain between runs, so we see the finalizers from earlier runs completing during later runs.)

What you should see from this is that IDisposable isn’t for disposing resources. One of the uses of IDisposable is, however, to provide some control over when those resources are released. A basic pattern you might use is this one:

public class Thing : IDisposable {
     public object FakeResource = new object();
     ~Thing() {
           releaseResources();
     }
     public void Dispose() {
           releaseResources();    // This still isn't the full pattern you should be using
     }
      private void releaseResources() {
           if (FakeResource != null) {
                FakeResource = null;
                 "Resource released!".Dump();
           }
     }
}

Now, if a Thing is wrapped in a using block, or Dispose() is called, the resource will be released immediately. If the caller fails to ensure Dispose() is called, the resource will still be released by the finalizer.

Hopefully you can see that a finalizer is what we should be using to ensure resources are released, and IDisposable gives us a way to control when that happens. This is what I meant about predictability, and it also improves our stability: if resources are cleaned up in a timely fashion, our system is less likely to run out of limited resources under heavy load. If we rely on the finalizer, we guarantee that the resource will be released, but it’s possible for large numbers of objects to be waiting to be finalized, while hanging onto resources which won’t be used again.

Performance

I promised that IDisposable can also make code run faster, and to do that we need to understand a little bit about the garbage collector.

In the CLR, our heap has three different generations, numbered 0, 1, and 2. Objects are initially allocated on the gen 0 heap, and are moved up to the gen 1 and 2 heaps as they last longer.

The garbage collector needs to make a fast decision about every object, and so every time it encounters an object during a collection, it does one of two things: collect the object, or promote it to the next generation. This means that if your object survives a single gen 0 garbage collection, it will be moved onto the gen 1 heap by copying the memory and updating all references to the object. If it survives a gen 1 garbage collection, it is again moved – it is copied to the gen 2 heap, and all references are updated again.

The other thing you need to understand is how finalizers get called. When the garbage collector encounters an object which needs to be finalized, it has to put it on a queue and leave it uncollected until the finalizer has run – but remember that the garbage collector can only do two things: collect or promote. This means that the object has to be promoted to the next generation, just to give it time for the finalizer to be run.

Let’s look at some numbers again. The following code has a simple finalizer which just adds to some counts: the total number of objects finalized, and the number which reached the later generation heaps.

void Main()
{
     Thing.Gen1Count = 0;
     Thing.Gen2Count = 0;
     Thing.FinaliseCount = 0;
     for (int repeatCycles = 0; repeatCycles < 1000000; repeatCycles++) {
            var n = new Thing();
     }
     GC.Collect();
     GC.WaitForPendingFinalizers();
     ("Total finalizers run:" + Thing.FinaliseCount).Dump();
     ("Objects which were finalized in gen1:" + Thing.Gen1Count).Dump();
     ("Objects which were finalized in gen2:" + Thing.Gen2Count).Dump();
}

public class Thing {
     public static int FinaliseCount;
     public static int Gen1Count;
     public static int Gen2Count;
     ~Thing() {
           finalize();
     }
     private void finalize() {
           FinaliseCount += 1;
            var gen = GC.GetGeneration( this);
            if (gen == 1) Gen1Count++;
            if (gen == 2) Gen2Count++;
     }
}

After running this a few times, it’s quite clear that the performance is all over the place. I got run-times ranging from 0.5 seconds up to 1.1 seconds. A typical output looks like this:

Total finalizers run: 999999
Objects which were finalized in gen1: 118362
Objects which were finalized in gen2: 881637

As you can see, most objects go through two promotions before they are collected, incurring a significant overhead.

With a few changes, we can significantly improve this situation.

void Main()
{
     Thing.Gen1Count = 0;
     Thing.Gen2Count = 0;
     Thing.FinaliseCount = 0;
     for (int repeatCycles = 0; repeatCycles < 1000000; repeatCycles++) {
           var n = new Thing();
           n.Dispose(); // This is new - we could also have used a using block
     }
     GC.Collect();
     GC.WaitForPendingFinalizers();
     ("Total finalizers run: " + Thing.FinaliseCount).Dump();
     ("Objects which were finalized in gen1: " + Thing.Gen1Count).Dump();
     ("Objects which were finalized in gen2: " + Thing.Gen2Count).Dump();
}

public class Thing : IDisposable {
     public static int FinaliseCount;
     public static int Gen1Count;
     public static int Gen2Count;
     public void Dispose() {
           finalise();
           GC.SuppressFinalize(this); // If we can perform finalization now, we can tell the GC not to bother
     }
     ~Thing() {
           finalise();
     }
     private void finalise() {
           FinaliseCount += 1;
           var gen = GC.GetGeneration(this);
           if (gen == 1) Gen1Count++;
           if (gen == 2) Gen2Count++;
     }
}

The changes I have made is to make Thing implement IDisposable, make the Dispose() method call GC.SuppressFinalize(this), and make the main loop call Dispose(). That tells the garbage collector that the object has already finished disposing of any resources it uses, and it can be collected immediately (instead of being promoted and placed on the finalizer queue).

The code now runs in a very consistent 0.2 seconds – less than half the original – and the output looks like this:

Total finalizers run: 1000000
Objects which were finalized in gen1: 0
Objects which were finalized in gen2: 0

As you can see, the finalizers now all run while the object is still in gen 0. Measuring using the Windows Performance Monitor tells a similar story: in the version which uses only the finalizer, the monitor records numerous promotions and an increase in both gen 1 and 2 heap sizes. We don’t see that happening when we use the Dispose() method to suppress the finalizer.

So there you have it. Finalizers are for guaranteeing your resources get released. IDisposable is for making your code faster and more predictable.

LINQ and time complexity and data structures, oh my!

LINQ is a wonderful thing. It significantly enhances the expressiveness of C#, and provides lots of other benefits as well. Unfortunately, it comes with a cost.

It can hide things from you.

One of the real dangers is out-of-control time complexity. How many times will the following code perform the .Distinct() operation?

var rnd = new Random();
var values = Enumerable.Range( 1, 1000).Select(r => rnd.Next(10));

var uniqueValues = values.Announce( "Performing Distinct() operation...").Distinct();
if (uniqueValues.Count() > 2) uniqueValues.First().Dump();

If you answered ‘two’, congratulations! My output looks like this:

Performing Distinct() operation...
3

Of course, ReSharper warns you about this: “Possible multiple enumeration of IEnumerable”. ReSharper won’t catch all sins, though. I ran into something similar to this recently:

// Example data
var rnd = new Random();
var values = Enumerable.Range(1, 10000).Select(r => rnd.Next(10)).ToList();
var otherData = Enumerable.Range( 1, 10000).Select(r => rnd.Next(20)).ToList();
var counter = new object();

// Problem code
var uniqueValues = values.CountCalls(counter).Distinct();
var otherDataWhichMatchesValues = otherData.Where(od => uniqueValues.Contains(od));
otherDataWhichMatchesValues.Count().Dump();
MyExtensions.GetCallCount(counter).Dump();

That took 19 seconds to run, and made 10,000 calls to Distinct()! Can you see what’s going on? The Where() operation is testing each entry in otherData against uniqueValues – enumerating uniqueValues once for every entry in otherData – and ReSharper 8 doesn’t warn you about it! If you’re used to seeing that warning whenever you try to enumerate an IEnumerable more than once, you might be tempted to think that it won’t happen. You would, of course, be wrong.

A Distinct() operation runs in O(n) time, Where() introduces an additional O(n), and .Contains depends on the underlying data structure – which in this case, is a List. So our overall operation is running in O(n^3) – that’s a real performance killer on any non-trivial data set.

Dropping a .ToList() after the .Distinct() reduces our run time to 3 thousandths of a second, and reduces our Distinct() operations to one. Much better! (Well, at least, it seems that way for now.)

I have a habit which ReSharper doesn’t like much. I usually avoid methods like Count(predicate), and prefer to chain a Count() on the end of a Where(predicate). One of the reasons I do this is that I think it makes it clearer which calls are LINQ queries, subject to multiple evaluations, and which calls will cause evaluations. Of course, that doesn’t help if you don’t spot that .Distinct() is in the LINQ namespace in the first place!

It’s easy to forget about things like time and space complexity, but there’s a reason you learned that stuff: It’s important! Whenever you write a loop or make a LINQ call, something in the back of your mind should be thinking about how nested the current operation is, and how much time and space complexity you’re layering on top. That’s not to say that you should necessarily optimise everything, but it may help you to spot problems before they get out of control.

There are two bigger-picture lessons to learn from this.

Algorithms and Data Structures

The real root of the problem, in this case, came from not thinking through the algorithm or selecting appropriate data structures. Rather than trying to decide on an outcome first, the programmer has worked through a series of operations against the available data, until it has ended up in the right shape. You can picture the thought process:
– I need to get the entries in otherData which match entries in the values list.
– That will be slow, so I’ll call distinct on values.

The fix – adding a call to ToList() after calling distinct – has unfortunately introduced a more subtle performance bug. It works well for the test data set, but it won’t perform as well if values is sparse: if Distinct() removes a lot of duplicates, then we’ll see a performance improvement, but if there are few duplicates, the original problem the programmer was trying to fix will remain. Let’s measure.

// Example data
var rnd = new Random();
var dataRange = 10;
var values = Enumerable.Range( 1, 10000).Select(r => rnd.Next(dataRange)).ToList();
var otherData = Enumerable.Range( 1, 10000).Select(r => rnd.Next(dataRange)).ToList();
var counter = new object();

// Operation
for ( int i = 1; i < 100; i++) {
     var uniqueValues = values.CountCalls(counter).Distinct().ToList();
     var otherDataWhichMatchesValues = otherData.Where(od => uniqueValues.Contains(od));
     otherDataWhichMatchesValues.Count().Dump();
}

We’ve now introduced a variable – dataRange – which will roughly control how many duplicates we’ll get. This code roughly parallels our original, with the ToList() fix (run through numerous iterations to exaggerate the timings). As is, it completes in 0.6s, but if we change dataRange to 1000, the run-time increases to 5.4s.

Consider the operations we want to do. We’re looking to build the ‘values’ dataset in the first place, and then we’re going to make many calls to .Contains() against it. While the time complexity of an insert operation on a list is O(1), Contains() is O(n). What we really want is a data structure which is O(1) for both insert and contains operations – and that’s a hash. So the fix we should really make is to change the values dataset to a HashSet, and drop the distinct operation altogether:

var rnd = new Random();
var dataRange = 10;
var values = new HashSet<int>(Enumerable.Range(1, 10000).Select(r => rnd.Next(dataRange)));
var otherData = Enumerable.Range(1, 10000).Select(r => rnd.Next(dataRange)).ToList();
var counter = new object();

for (int i = 1; i < 100; i++) {
     var otherDataWhichMatchesValues = otherData.Where(od => values.Contains(od));
     otherDataWhichMatchesValues.Count().Dump();
}

Now the run time is around 0.1s, regardless of the value of dataRange. As we can see, it’s not only faster in the sparse case, but it’s faster even than the ideal case with many duplicates – which we timed at 0.6s with 100 iterations.

I see a lot of developers who have a favourite data structure – usually a list or an array – and rarely or never make use of other data structures. If a piece of code has emerged as a target for optimisation, you may as well optimise it properly the first time around. Throwing a .ToList() onto the end of a LINQ expression is kind of a code smell: it indicates that you may not have selected the right data structure in the first place. Unless, of course, you’ve looked at the time complexities of the operations you need, and a list is a good fit: in which case, by all means ToList() it! If you’re feeling particularly lazy, want to ignore everything I’ve said so far, and roll the dice, you could even just .ToRandomCollectionType() it.

Over-reliance on tools

As a final thought, I want to caution people against over-reliance on tools. The problem is not that the developer relied on ReSharper to spot multiple enumerations; even if they’re used to spotting them without it, this is an unusual operation (which is why the ReSharper rule didn’t catch it – and yes, there is an open issue to address exactly this situation). The problem emerges when the developer not only starts to rely on ReSharper to pick up rules like this one, but starts to assume that code without ReSharper warnings is good code. That goes hand-in-hand with the fact that ReSharper isn’t always able to fix the warnings appropriately: in this case, even if ReSharper had caught the problem, its solution – to enumerate the IEnumerable to a list – wouldn’t have been the appropriate (or at least, the best) solution.

Shared session factories in NHibernate

NHibernate really is a fantastic ORM… unless you use it badly. Or unless you use it kinda OK. Or unless you use it almost-but-not-quite-perfectly. Then it can be a right pain in the neck. There are a lot of things you can get wrong, and those things can cause you a world of pain.

The particular pain I dealt with recently was memory pressure.

One of the most crippling things you can do to a server is to fill up its RAM. Once your RAM is full, your OS has to start copying things out of RAM onto disk, and then back into RAM when you need to use them again. Disks are slow – much, much slower than RAM – and this is going to hurt your performance badly.

Picture this. You’ve done all the right things. Your software is built using a loosely-coupled Service-Oriented Architecture. You have a website, and it hands all sorts of tasks off to a separate service layer. You have a second service handling various data import tasks. As your load increases, it’s going to be very easy to scale horizontally: you can move your services off to separate servers, and the only thing you need to do is update a few network addresses. Once you expand beyond what you can handle with four servers (those three functions plus a separate database server), you can load-balance each function individually.

You’ve also decided to handle multiple tenants with multiple databases. This one isn’t the right decision in every situation, but there are lots of times when it makes sense, particularly if you’re holding a lot of data for each client. It makes it trivial to archive individual clients off. It makes it easy to offer different tiers of backup. It stops your row-counts from getting too high, and it isolates small clients from the performance headaches of the massive data sets maintained for larger clients.

NHibernate is going to kick you in the teeth for doing this.

We’ve been watching the problem approach for a while now. The base memory overhead for each process soared past a gigabyte some time ago. As our client list headed towards a hundred, our memory overhead headed towards two gigabytes per process. I didn’t need to run a memory profiler to know where the problem was (although I did use one to confirm my suspicions). The culprit was the NHibernate session factories. A single session factory can run towards 20 MB. With fifty clients, that means you have a full gigabyte of RAM filled with nothing but session factories. I didn’t want to have to start scaling horizontally early just because of this, and after all, this gigabyte of memory consisted of lots and lots of copies of 20 MB structures which were identical except for a single string: the database connection string. That’s horribly wasteful. (Actually, there were other differences, but we’ll get to those.) I also couldn’t start disposing of session factories once they hadn’t been used for a little while: these things take a while to construct, and we can’t let our users sit around for several seconds when they log in for the first time in a while. I needed to start re-using our session factories.

There are at least two approaches you can take here. The one I chose has two caveats: firstly, that you’re using NHibernate.Cfg.Environment.ReleaseConnections = “on_close”, and secondly that you’re not using stateless sessions at all. We’ve been moving towards ditching stateless sessions for some time anyway, because stateless sessions don’t support listeners, so the second requirement wasn’t a problem for us. The first setting is a bit more troubling, because it’s legacy behaviour: rather than letting NHibernate manage connections using one of its newer strategies, it forces NHibernate to provide a connection when a session is first opened, and use that connection for the duration of the session. This was acceptable because we were already using the legacy setting, for reasons undocumented in either code comments or our source control history. I haven’t looked into the costs and benefits of this legacy mode compared to the other strategies.

So, let’s dive into some code. First of all, you’re going to need to set your connection provider:

       cfg.SetProperty(Environment.ConnectionProvider,
                       typeof(SharedCompanyConnectionProvider).AssemblyQualifiedName);

Then, seeing as there’s no such thing as a SharedCompanyConnectionProvider, you’ll need to implement it!

        public class SharedCompanyConnectionProvider : DriverConnectionProvider
        {
            protected override string ConnectionString
            {
                get { return NHibernateSessionManager.Instance.DatabaseSettings.GetCurrentDatabaseConnectionString(); }
            }
        }

If that looks a bit scary, good. If not, let me explain. Your connection provider is no longer thread-safe! It’s relying on a singleton which serves up a connection string. This is dangerous code, and you need to be careful how you use it. (Don’t even think of using this without putting some tests around it – see later in this post.)

Now, on to wherever it is you build your sessions. Mine looks something like this:

            private static readonly object CompanySessionFactoryLockObject = new object();
            ...
            lock (CompanySessionFactoryLockObject)
            {
                var sessionFactory = NHibernateSessionManager.Instance.GetSessionFactory();
                NHibernateSessionManager.Instance.DatabaseSettings.SetCurrentDatabaseConnectionString(databaseGUID);
                ISession session = sessionFactory.OpenSession();
            }

I’ve removed a lot of the detail, but that should give you the gist of what’s going on. The key component here is the lock() line. Now that our connection provider isn’t thread-safe, we have to ensure no other threads interrupt between setting the connection string on the singleton, and creating the actual session (at which time the connection provider will provide a session with the current connection string).

The final step in the process is to make sure you have some thorough testing around what you’re doing. The risk of getting it wrong is that your session factory hands you a connection to the wrong database, and that could be very bad. I’m not going to run through the entire test setup, but it’s certainly not a unit test – this thing runs in a test suite which uses a real database instance and creates (in the case of this test) five complete databases which we’ll be accessing from various threads.

        private volatile static string _assertFailed;
        private const int NumThreadsPerDb = 2;

        [Test]
        public void HammerMultipleDatabasesSimultaneously_BehavesWell()
        {
            List<Thread> runningThreads = new List<Thread>();
            foreach (var coGuid in companyGuids)
            {
                for (int i = 0; i < NumThreadsPerDb; i++)
                {
                    var thread = new Thread(StartHammering);
                    runningThreads.Add(thread);
                    thread.Start(coGuid);
                }
            }
            while (runningThreads.Any(thread => thread.IsAlive))
            {
                if (_assertFailed != null)
                    runningThreads.ForEach(thread => thread.Abort());
                else
                    Thread.Sleep(1000);
            }
            if (_assertFailed != null) Assert.Fail(_assertFailed);
        }

        public void StartHammering( object companyGUIDObj)
        {
            // nb don't assert on a thread. We're set up to set a message into _assertFailed instead.
            var CompanyGUID = (Guid)companyGUIDObj;
            string expectedDbName = CoDatabaseNames[companyGuids.IndexOf(CompanyGUID)];
            try
            {
                Entity entity;
                using (var session = NHibernateSessionManager.Instance.GetNewSession(CompanyGUID))
                {
                    // Set up the entity with some unique data
                    session.Save(entity);
                }
                for (int i = 0; i < NumTests; i++)
                {
                    using (var session = NHibernateSessionManager.Instance.GetNewSession(CompanyGUID))
                    {
                        if (!session.Connection.ConnectionString.Contains(expectedDbName))
                            throw new Exception( "Got a connection for the wrong database!");
                        var ent = session.Get<Entity>(entity.GUID);
                        // Check some unique thing about the entity. Change it to something else for the next iteration.
                    }
                }
            }
            catch (ThreadAbortException) { }
            catch (Exception ex)
            {
                if (!ex.ToString().Contains( "ThreadAbortException"))
                    _assertFailed = ex.ToString();
            }
        }

There’s a lot going on there. The key theme is that we’re creating a bunch of threads, and each thread is assigned to a particular database. New sessions are continuously created, and then queried to ensure they contain the expected object. If the object is not found, or the session has the wrong connection string, then something has gone wrong, and the whole system isn’t behaving in a thread-safe fashion.

Note that in a multi-threaded test situation, you cannot just throw an exception if something goes wrong – you need to pass information about the failure to your primary thread.

One final (and important) step is to ensure the test does fail appropriately if the system doesn’t behave as expected. Remove the lock statement around your session creation code and run the test; you should see it fail. Adding the lock back in should fix it.

Intuitive Interfaces

AgileKanbanLean Startup. We have more and more ways to think about the software development process, and our industry is getting better and better at what we do. We’re wasting less time, and delivering a more customer-focused product. New businesses have great tools to build great teams. We know how to manage source code, and some people have even worked out how to manage changing data models! Issue tracking is, by and large, a solved problem, and we have tools to keep our software fully tested and behaving the way it should.

What I don’t see enough focus on these days is the code we write. Sure, we’re all doing peer reviews (right?) and we think we manage code quality through unit testing. What worries me is that, usually, this just ensures that our code works. It does nothing to really manage quality. What’s wrong with this code?

class CreditCard
{
  private Decimal _Limit;
  //...
  public bool RaiseLimit(Decimal amount)
  {
    _Limit += amount;
    //....
  }
  //...
}

This is a blatant example, but it’s a problem I see all the time. The code looks clear enough, and it’s going to work. It will build, pass your unit tests, and there’s every chance it will pass peer review – but it shouldn’t. The problem is, there is a risk that someone will do this:

Decimal oldLimit = card.Limit;
Decimal newLimit = ...;    // Code to calculate the new limit
card.RaiseLimit(newLimit);

… and that would be awful! The caller has gone to the effort of calculating the new limit and passing it to RaiseLimit(), but that’s not what RaiseLimit() expects: it expects to be passed the amount the limit should be increased by. How do we solve this? There is a simple change we can make to reduce the risk this will happen. Our improved code might look like this:

public bool RaiseLimit(Decimal increaseAmount)
{
  _Limit += increaseAmount;
  //....
}

Functionally, nothing has changed – but we’ve provided an extra clue to a developer calling our function. In these days of intelligent IDEs, coders usually get to see the method signature that they’re calling. We should endeavour to take every possible advantage of IDE features like these to streamline code creation and reduce the chance of errors.

This is one simple example from a whole spectrum of things you can do to optimise code-writing. I have wasted countless hours reading through classes trying to work out how to use them. Here’s a recent example I ran into:

class ConfiguredTask
{
  public string ConfigFolder;
  public string TaskExe;
  public void WriteMainConfig(DateRange dates, string configName) {...}
  public void WriteSecondaryConfig(DateRange dates, string configName) {...}
  public void RunTask(string path, DateRange dates) {...}
  public ResultSet GetResults(DateRange dates) {...}
  //....
}

To use this effectively, you need to know quite a bit about the internal class. For a start, you need to know that you need to write the main and secondary config files before calling RunTask() – not as obvious as you might think, as there are dozens of other public methods and properties on this class. Second, you need to know that the two functions to write config files are expecting filenames with full path information, and they need to be different, but in the same folder. Third, you need to know that RunTask() persists the results of the task both into the database – something I didn’t want – and leaves output in the folder referenced by ConfigFolder. TaskExe must contain the name of the file to run, but must not contain any path – the executable must be in the path referenced by ConfigFolder. That wasn’t even the end of it! The code to run a task used to look like this:

task.WriteMainConfig(selectedDates, @"c:\main.cfg");
task.WriteSecondaryConfig(selectedDates, @"c:\second.cfg");
task.RunTask(task.ConfigFolder, selectedDates);
ResultSet results = task.GetResults(selectedDates);

Keep in mind that, if you didn’t have an example to hand, you had to read a fair portion of the class itself to make sure you had everything right! After I was finished with it, the class looked like this:

class ConfiguredTask
{
  public string PathToExecutable;
  public string ResultsFolder;
  private void WriteMainConfig(DateRange dates) {...}
  private void WriteSecondaryConfig(DateRange dates) {...}
  public ResultSet RunTask(DateRange dates,
    bool persistResults=true, string WorkingFolder=null) {...}
  public ResultSet GetResults(DateRange dates) {...}
  //...
}

Just through a little re-factoring and a handful of code tweaks, the caller now knows to give a full path to the executable (which can now be anywhere), they don’t need to know about writing config files (it’s done during RunTask()), they know that results are persisted by default but they can override that behaviour, they know they can provide an optional working folder, and they don’t have to call GetResults() after every call to RunTask() when they want the results of that task.

I’ve taken a class which needed quite a bit of reading to work out how to use it, and turned it into a class you can use with no more information than what IntelliSense shows you as you code. The code to run a task and get the results now looks like this, instead:

ResultSet results = task.RunTask(selectedDates);

I hope you can see why this would save a future developer time! We should strive for all of our classes to be like this. The idea of ‘self-documenting code’ doesn’t quite capture this: the whole point is to not have to read the code at all. I prefer the term ‘Intuitive Interface’. As a developer, you should aim for all of your classes to have this kind of intuitive interface. Think of the questions a caller might need answered, and then answer them – in your method signature if possible, and if not, in a method comment (ideally, in a fashion that leverages the IDE you’re working in):

/// <summary>
/// If the instrument is not running, set the passed-in mode and start it running.
/// If the instrument is already running it will *NOT* change the mode.
/// </summary>
private void EnsureInstrumentIsRunning(InstrumentMode mode)
{
  // ...
}

Even in that example (which I took from a current project), the first line is really extraneous – it’s repeating information that’s already available in the method signature.

Monitors and Coffee

There are all sorts of things to get right and wrong when you’re building software. There’s a lot to think about when you’re kitting up your team. What OS should desktops run? What tools will we use? How much should we spend on office chairs? One of the most important decisions you’ll make is what sort of monitor your developers get, and how many.

I’m not joking about. Your developers are going to be spending a fairly large fraction of their professional lives looking at their monitors. You really want to make it a pleasant thing to do. The standard I tend to see these days is to give developers a pair of 22″ wide-screen monitors. That might sound excessive, and other staff might be resentful, but it’s really not that costly these days. A good 22″ wide-screen might cost $500, as compared to a cheap small screen which costs, say, $350. Going for twin 22″ screens means spending $1000 instead of $350. Given that a good-quality monitor will often last upwards of three years, this means you’re spending a little over $200 a year per developer.

So what do you get out of it? Plenty. First of all, your developers will quite likely be more productive. I find debugging code to be much easier when I can have an application running full-screen on one monitor while my debugging tools are on the other. Tuning CSS is easier when I can look at the context in a browser while I’m editing the file. Visual Studio is much easier to use when you can devote an entire screen to code or UI layout while still having all of your explorers, editors, and toolboxes visible on the other. Widescreens make comparing versions of code files much simpler.

At one previous job, one of my screens had a rotating stand, and I ended up turning it on its side and using it mostly for editing code. I could see a lot more context when I had the entire ‘width’ of a 22″ widescreen in height. This tended to play havoc with remote desktop sessions, however. Most annoying was that whenever my manager connected back to his machine from mine, it re-shuffled his entire desktop. Use with caution!

This advice doesn’t just apply to screens. If your developer machines are slow, they’ll end up waiting for things they do frequently. When they have to wait a lot, they’ll find things to do while they wait. You’d be amazed at how much productivity you lose if your developers alt-tab to facebook every time they hit the build button! Fast computers for your developers are vital. Consider getting machines with RAID controllers, and mirroring their drives: developers tend to spend more time customizing their workstation than any other sort of employee, and having to re-build their machine results in more lost time than just any un-committed code changes. A software developer is likely to have all sorts of settings on their IDE; they’ll have lots of little productivity tools installed, like their favourite code editor, and perhaps a little tool to help them build regexs; macros and little time-saving scripts and other things. It will cost them time, and worst of all, it will be frustrating, to have to get everything just right again. Having mirrored drives helps to reduce the chance this will happen. Your other alternative is to have a good backup and recovery system for each developer workstation, but just having RAIDed drives is probably cheaper and easier to manage.

There are lots of little things to do to make your programmers happier where they work. Remember, they spend 40-odd hours a week in front of their PC. The more pleasant it is, the happier they’ll be, and you’ll tend to get more out of them. If the chairs are uncomfortable, they’ll dread coming in to those 8-hour days, and you’ll spend more on sick leave. If the coffee in the office is terrible, your whole programming team will start leaving together two or three times a day for ‘a quick coffee up the road’. Multiply your charge-out rate by the number of programmers in your team by 1/4 (for 15 minutes) by three, and that’s what it costs you every day to not have good coffee in the office.

I’ve seen a lot of workplaces who skimp on the little luxuries because they’re seen as ‘too costly’. You know what’s really too costly? When your programmers see photos of the office of one of their former colleagues, and the double-22″ monitors make your single 19″ look like a cage. When the espresso machine in the common room trumps the tin of International Roast you keep under the sink. When the former colleague gets a huge glass whiteboard, while you give your developers butcher paper and pencils. You know what will happen? You’ll have employees who treat their job as something to get them by until they find something better. They will join, they will hate it, and fairly soon, they will move on.

It’s simply too expensive to spend $350 per machine on monitors when you should be spending $1000.